


Have you ever wanted to expand or limit the data that your team can see? With InsightOut’s user and group permission settings, you'll be able to manage your team's data access at every level. Ensure that every team member has access to relevant data, that way, sales leaders can execute on the big picture strategy while sales reps focus on hitting their targets.
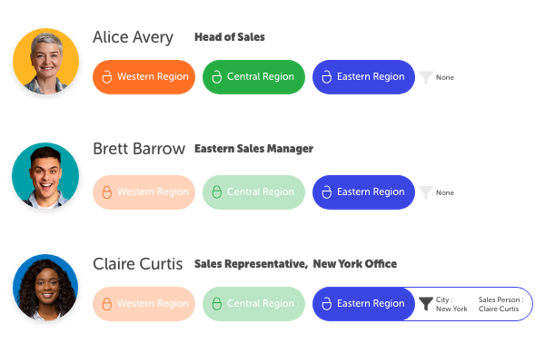
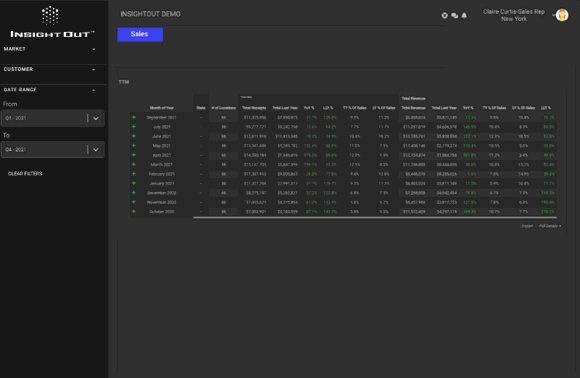
We know that every team has unique data requirements. InsightOut enables you to manage data access by source and function, with the ability to apply additional filters down to individual data sets. In the example above, job and city filters are applied to allow the New York-based sales team to see only what’s relevant for their hub.
Executive View
Sales leaders will have access to every dashboard across the division for a holistic view of the entire business.
Team Member View
Sales reps will have a limited, sales-focused dashboard, with insights to enhance individual and team performance.
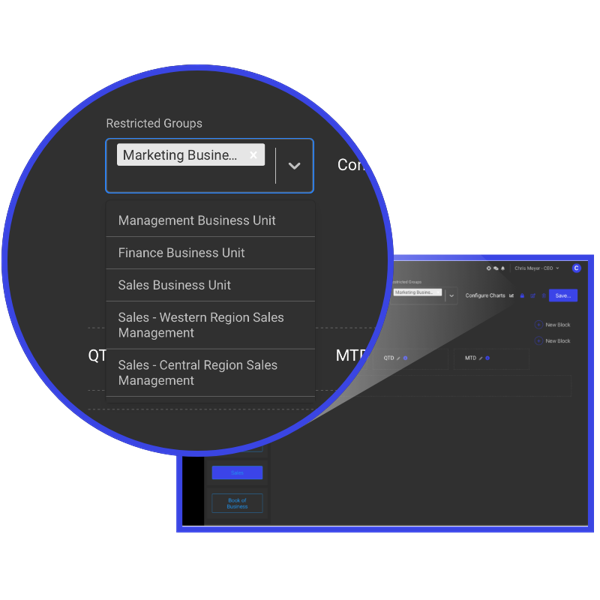
Manage group restrictions within your dashboard settings with ease.
Achieve less clutter for more focus and even greater impact.
Let’s face it. Data is often messy. That’s why the new Data Explorer engine in InsightOut makes it easy to explore and analyze large data sets. Say that you wanted to understand the revenue impact of your advertising program to realign your budget. Data Explorer allows you to quickly configure the display to show only what’s relevant for your analysis.
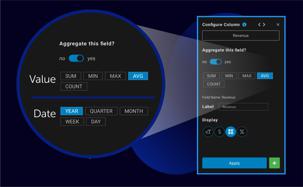
Have the power of data aggregation at your fingertips. Combine large volumes of data with the click of a button to see a summary by time or value. In the same report, we can aggregate the individual transaction date and revenue fields to show the total revenue generated per ad source by year.
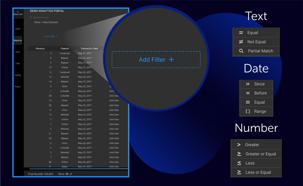
Further filter your data for more targeted insights. Using the same example, we can drill down further to show only LinkedIn ad-generated sales in the state of California over the last 5 years. Data Explorer’s user-driven, interactive report builder lets you get answers in minutes, not days.
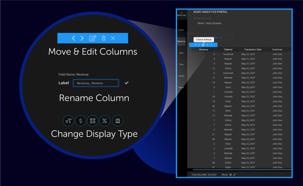
Separate signal from noise. Customize the display by the fields that are most important for your search or analysis.
Aggregate
Leave the Excel macros behind. Aggregate row-level data by type to easily conduct time-series analysis or find patterns in performance.
Use attributes to define what matters most to you. Apply a range of dynamic filters to text, date, or value data to narrow your analysis.
No need to reinvent the wheel with each report. Save your hard work and instantly load existing reports to share and collaborate.
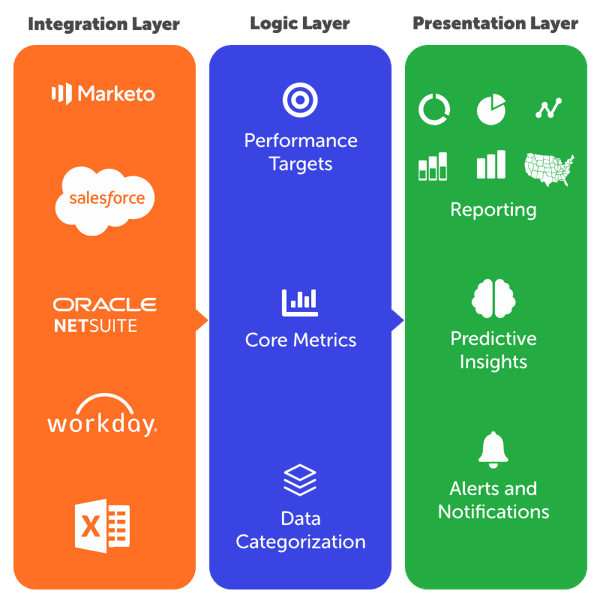
Understanding the ins and outs of your sales pipeline is no simple task. With multiple data sources that don't talk to each other and ad hoc Excel reporting, you're often left with unreliable metrics that don't paint a clear picture of your pipeline. InsightOut's Pipeline Analytics features are designed to give you clarity into every aspect of your sales process.
With IO, you can to connect all of your sales and marketing data, blend those data sources to measure core metrics against targets, and leverage in-depth visualizations with predictive insights that lead to more accurate forecasting and bigger wins.
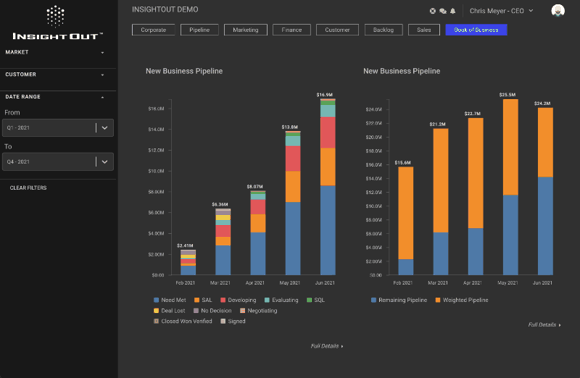
InsightOut features a specialized waterfall visualization for a granular view into your book of business, allowing you to track deals won, business lost, and month-over-month revenue.
See how your performance measures against your desired targets. Drill down into each quarter and see your numbers broken down into individual months.
InsightOut's dashboards feature a high-level overview of all your sales data. Easily track and measure your organization's progress, so you're always one step ahead.
Weighted charts enable you to see detailed performance trends of your entire product suite.
Track your progress to date. Always know how much closer every win gets you to your goal.
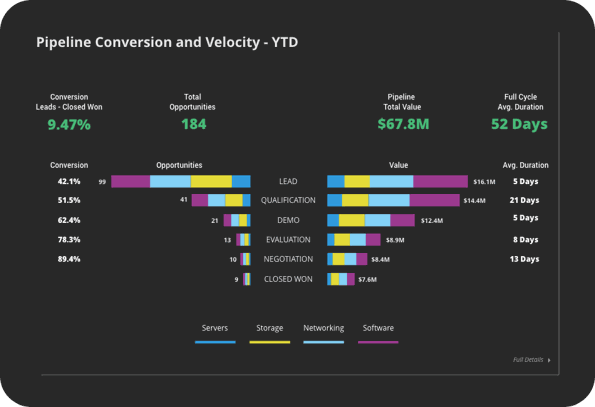
Take pipeline analytics to the next level with greater visibility into conversion rates and pipeline velocity. These enhanced features enable you to discover hidden trends and critical intel to optimize your sales operation with precision.
Get a detailed snapshot of your entire sales funnel at glance. Understand conversion rate changes at every stage and the average length of each cycle. Easily compare performance and share of pipeline by product. See where deals are getting stuck and make adjustments with data-backed insights.
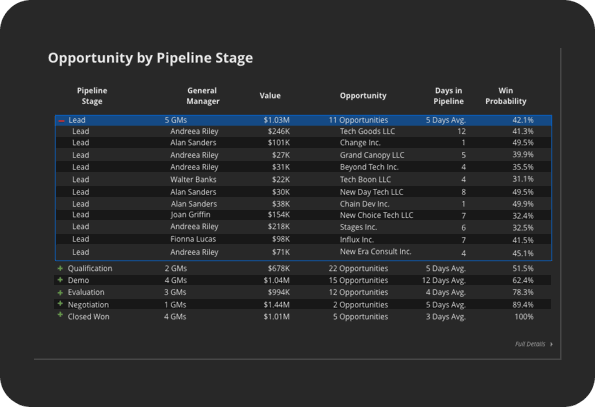
Drill into the pipeline for a tabular summary of every opportunity in each stage. Clear out stagnant opportunities and forecast with pinpoint accuracy.
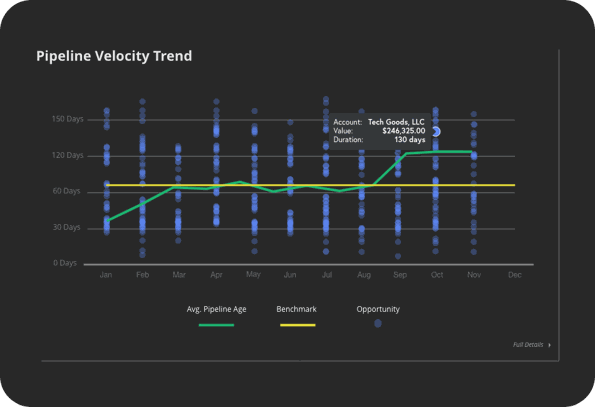
For a broader outlook, a velocity chart enables you to track the age of your pipeline over time. These insights are especially useful for strategic planning and refining internal processes.
Discover InsightOut's built-in data grooming features, with multiple ways to prime and prep your data to ensure it's always clean, accurate and consistent.
Duplicate data can occur for any number of reasons, storing unnecessary information and muddling data quality. InsightOut enables you to seamlessly eliminate dupes in your database for clean data and minimal noise.
Have multiple instances of an account, each with different spelling? This is a prime example of what we like to call 'dirty data,' which can be eliminated using InsightOut. Easily reconcile messy data entries to create consistency and keep confusion at bay.
Take your data sanitizing to the next level with InsightOut's mapping capabilities. Using raw data or specific keywords, you can blend and match data across varying categories for streamlined data that fosters efficiency.
We understand the importance of keeping tabs on changes made to your data. Say goodbye to tracking down people and email threads. Instead, welcome ease and clarity with IO’s drill down auditing.
Let’s say you want to track sales performance over the last year. This feature enables you to access target updates and modifications at every step. With a robust audit trail, you'll see exacly what changes were made, who they were made by and when, for every metric.
Have full visibilty into who made changes and when, with the entire modification history.
Always have the freshest and most accurate data with the ability to catch mistakes instantly.
Easily track progress of the most important KPIs over time. See how you arrived at every milestone.
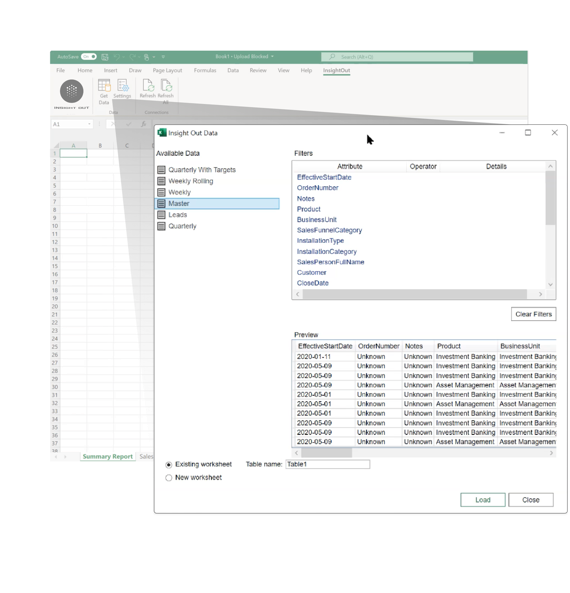
Love it or hate it, we all know the crucial role that Excel can play in your organizational reporting needs. And while InsightOut enables you to maximize data utilization, additional ad hoc reporting and forecasting is often inevitable.
That's exactly why we created the InsightOut Excel Plug-in. This connector let's you take your blended, cleansed data directly from IO and into Excel for custom modeling.
Let's say you want to report on revenue figures for the latest month. With IO's plug-in access your new data in 3 steps: